TOP 10 The line graph below illustrates population trends in Vietnam from 1960 to 2020
The line graph below illustrates population trends in Vietnam from 1960 to 2020 được biên soạn đầy đủ cấu trúc, hướng dẫn bài làm chi tiết giúp các bạn ôn luyện và đạt kết quả cao trong bài thi môn Tiếng Anh.
The line graph below illustrates population trends in Vietnam from 1960 to 2020
Đề bài: The line graph below illustrates population trends in Vietnam from 1960 to 2020. Write a description (120-150 words) of the graph. Use the expressions in 1, the model and tips in 2, and the suggestions below to help you
The line graph shows population trends in Vietnam from 1960 to 2020. Overall, the urban population ...
In 1960, most Vietnamese people ...
However, from 1960 to 1980, ... From 1990, ...
By contrast, the urban population rose throughout the same period. In 1960, ...
In 1980, ... From 1990, ...
The line graph below illustrates population trends in Vietnam from 1960 to 2020 (mẫu 1)
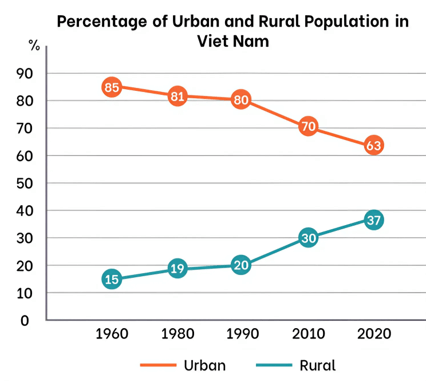
The line graph provides information about the proportion of urban and rural population in Vietnam between 1960 and 2020.
Overall, what stands out from the line graph is that the percentage of rural population followed an upward trend, while it was opposite for urban.
To commence with, most Vietnamese people lived in urban areas, accounted for 85%, which was the highest number in the chart in 1960. By contrast, this number decreased slightly by 4% in the next 20 years. Moreover, from 1990 to 2020, the percentage of urban population went down significantly, particularly from 80% to only 63%.
A closer look at the remaining data reveals that the proportion of rural population was approximately 15% throughout the same period, which was the smallest figure in the line graph. However, this number increased moderately to 19% in 1980, rising sharply from 20% to 37%, between 1990 and 2020 respectively.
The line graph below illustrates population trends in Vietnam from 1960 to 2020 (mẫu 2)
The line graph shows the urban and rural population in Vietnam from 1960 to 2020. Overall, the urban population increased while the rural population decreased.
In 1960, most Vietnamese people lived in rural areas. However, from 1960 to 1980, the percentage of the rural population fell slightly to 81 per cent. Then the figure remained stable for the next ten years. From 1990 to 2000, the proportion of the population living in rural areas continued to decrease gradually. In 2020, the rural population was only 63 per cent of the total population of Vietnam.
By contrast, the urban population rose throughout the same period. In 1960, the percentage of the city population was just around 15 per cent. The figure went up slightly in 1980 and remained stable until 1990 when less than 20 per cent of the population lived in urban areas. Since 1990, the proportion of the urban population has increased gradually and in 2020, it reached 37 per cent of the total population.
The line graph below illustrates population trends in Vietnam from 1960 to 2020 (mẫu 3)
The line graph shows population trends in Vietnam from 1960 to 2020. Overall, there is a clear shift from a predominantly urban population to a more balanced urban-rural distribution.
In 1960, a vast majority of Vietnamese people (85%) lived in urban areas, with only a small fraction (15%) residing in rural areas. However, from 1960 to 1980, the urban population decreased modestly, falling to 81%, while the rural population grew to 19%.
The trend continued from 1980 to 1990, with the urban population slightly declining to 80% and the rural population rising to 20%. The most significant changes occurred after 1990. By 2010, the urban population had decreased to 70%, and the rural population had increased to 30%.
From 2010 to 2020, the urban population continued to decline, reaching 63%, while the rural population rose to 37%. This indicates a significant migration from urban to rural areas in Vietnam over the past 60 years, leading to a more balanced urban-rural distribution.
The line graph below illustrates population trends in Vietnam from 1960 to 2020 (mẫu 4)
The line graph shows population trends in Vietnam from 1960 to 2020. Overall, the urban population has decreased significantly, while the rural population has increased over the same period.
In 1960, most Vietnamese people (85%) lived in urban areas, with only 15% residing in rural areas. However, from 1960 to 1980, the urban population slightly decreased to 81%, while the rural population rose to 19%. From 1980 to 1990, the urban population continued to decrease to 80%, and the rural population increased marginally to 20%.
A more pronounced change occurred from 1990 onwards. By 2010, the urban population had dropped to 70%, while the rural population had risen to 30%. This trend continued, and by 2020, the urban population had further decreased to 63%, with the rural population increasing to 37%.
Overall, the data indicates a shift from a predominantly urban population to a more balanced distribution between rural and urban residents in Vietnam over the six-decade period.
The line graph below illustrates population trends in Vietnam from 1960 to 2020 (mẫu 5)
The line graph illustrates changes in the urban and rural population percentages in Vietnam from 1960 to 2020. It is notable that while the proportion of rural residents showed a consistent upward trend, the urban population trended downwards.
Initially, the urban population was predominant, peaking at 85% in 1960, the highest point on the graph. However, over the next two decades, this figure decreased slightly by 4%. From 1990 onwards, there was a significant decline in urban population percentage, dropping notably from 80% to 63% by 2020.
Conversely, the rural population started at approximately 15% in 1960, the lowest point shown. This percentage saw a moderate increase to 19% by 1980 and then rose sharply to 37% by 2020.
The line graph below illustrates population trends in Vietnam from 1960 to 2020 (mẫu 6)
The line graph illustrates the trends in urban and rural populations in Vietnam from 1960 to 2020. Overall, the graph shows that the urban population has steadily increased while the rural population has gradually declined over the 60-year period.
In 1960, a significant majority of the Vietnamese population, 85%, lived in rural areas. The rural population slightly decreased to 81% by 1980 and remained relatively stable until 1990. However, from 1990 onwards, the proportion of the rural population gradually declined, reaching 63% in 2020.
On the other hand, the urban population in Vietnam rose during the same period. In 1960, only 15% of the population lived in urban areas. This percentage increased slightly to 19% by 1980 and then remained stable until 1990. From 1990 to 2020, the urban population grew steadily, reaching 37% by the end of the period.
Dịch nghĩa
Biểu đồ đường minh họa xu hướng dân số đô thị và nông thôn ở Việt Nam từ năm 1960 đến năm 2020. Nhìn chung, biểu đồ cho thấy dân số đô thị đã tăng đều đặn trong khi dân số nông thôn giảm dần trong suốt 60 năm qua.
Vào năm 1960, phần lớn dân số Việt Nam, 85%, sống ở khu vực nông thôn. Dân số nông thôn giảm nhẹ xuống còn 81% vào năm 1980 và vẫn ổn định cho đến năm 1990. Tuy nhiên, từ năm 1990 trở đi, tỷ lệ dân số sống ở nông thôn giảm dần, chỉ còn 63% vào năm 2020.
Ngược lại, dân số đô thị ở Việt Nam tăng trong cùng giai đoạn này. Năm 1960, chỉ có 15% dân số sống ở khu vực đô thị. Tỷ lệ này tăng nhẹ lên 19% vào năm 1980 và sau đó duy trì ổn định cho đến năm 1990. Từ năm 1990 đến 2020, dân số đô thị tăng đều đặn, đạt 37% vào cuối giai đoạn.
Xem thêm các chương trình khác:
- 1000 câu hỏi ôn tập môn Công nghệ có đáp án
- 1000 câu hỏi ôn tập Giáo dục công dân
- 15000 câu hỏi ôn tập môn Toán có đáp án
- Wiki Toán | Khái niệm, định lí, tính chất, dạng bài, công thức
- Tuyển tập đề thi + chuyên đề ôn thi Toán Kangaroo các cấp độ (có đáp án 2024)
- 3000 câu hỏi ôn tập môn Vật lí có đáp án
- Tổng hợp Dạng bài - Công thức môn Vật lí
- Phương trình hóa học | Tổng hợp PTHH của các chất hữu cơ, vô cơ chính xác nhất
- Đồng phân & Công thức cấu tạo của các chất hữu cơ
- Nhận biết các chất Hóa học
- Cấu hình electron
- So sánh bán kính nguyên tử và bán kính ion
- 1000 câu hỏi ôn tập môn Hóa có đáp án
- Wiki các chất hóa học | Định nghĩa, tính chất, nhận biết, điều chế, ứng dụng
- Cách đọc danh pháp hóa học (chương trình mới) đầy đủ nhất
- Công thức Lewis của một số chất thường gặp (chương trình mới)
- Công thức electron của một số chất thường gặp (chương trình mới)
- Công thức cấu tạo của một số chất thường gặp (chương trình mới)
- Công thức hợp chất khí với hidro của các nguyên tố (phổ biến) | Cách viết công thức hợp chất khí với hidro
- Công thức hidroxit cao nhất của các nguyên tố (phổ biến) | Cách viết công thức hidroxit cao nhất
- Công thức oxit cao nhất của các nguyên tố (phổ biến) | Cách viết công thức oxit cao nhất
- 2000 câu hỏi ôn tập môn Tin học có đáp án
- 3000 câu hỏi ôn tập môn Lịch sử có đáp án
- 3000 câu hỏi ôn tập môn Địa lí có đáp án
- 2000 câu hỏi ôn tập môn Sinh học có đáp án
- Tổng hợp Dạng bài - Công thức môn Sinh học
- Tổng hợp về các tác giả văn học
- 3000 câu hỏi ôn tập môn Ngữ văn có đáp án
- Tổng hợp kiến thức Ngữ Văn
- Tuyển tập truyện dân gian, truyền thuyết, cổ tích,... Việt Nam
- Tổng hợp các đề đọc - hiểu có đáp án chi tiết
- Trò chơi Powerpoint | Game Powerpoint
- Tổng hợp bài thu hoạch BDTX Giáo viên mầm non (2025) theo Thông tư 12
- Tổng hợp bài thu hoạch BDTX Giáo viên tiểu học (2025)
- Tổng hợp bài thu hoạch BDTX Giáo viên THCS (2025)
- Tổng hợp bài thu hoạch BDTX Giáo viên THPT (2025)